Hello, a friend's here's another Crypto homework given by our crypto professor @stream4u.
So let's start with the topics.
1. What is a Green & Red candle?
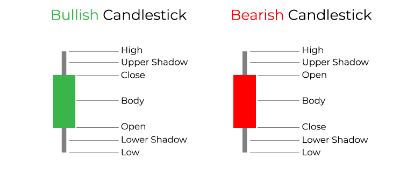
Green & Red candles both are the candles that show the movement of the price of a particular coin. As we can know red is used to show the symbol or red so here in the crypto market also when the price goes down it's dangerous for the investors and similarly when it goes up candle's color is green. it is one of the easiest ways to remember.
In short green candle represent bullish movement and the red candle represent bearish movement.
I found this picture to explain the red and green candlestick in one of the easiest ways. When it open, when closed, what is the highest and lowest point.
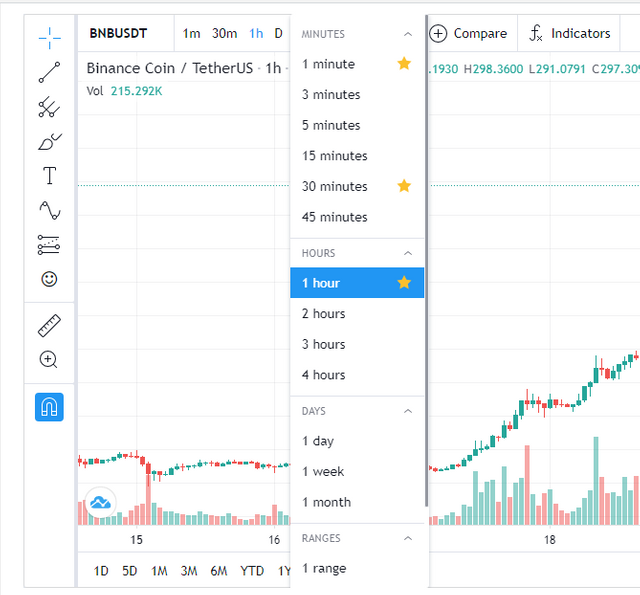
2. what are the time frames available?
as we see in the crypto professor @stream4u post that there are various time frames starting from 1 minute to 1 year and all time. From my point of view, the weekly time frame is best for short term trading because you get a good idea about the movement of the particular coin from the weekly time frame chart, and for the long term, we can prefer monthly or yearly and never go for the all-time chart because in past may the condition of the coin is different so don't go for all time chart while doing any type of trading.
3. candle chart in a different time frame
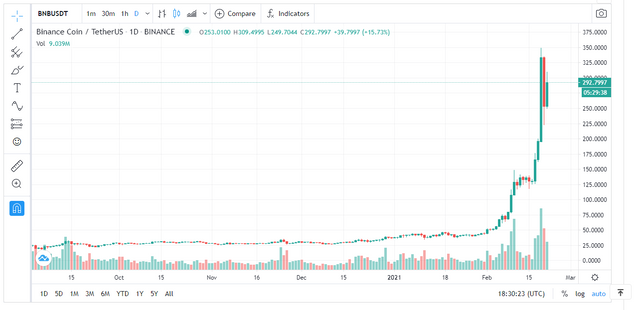
This is the candle chart of the BNB in a Day time frame. in the daytime frame, you can see it is completely in a bullish trend from the past few days.
But not let's see the chart in a 1hr time frame.
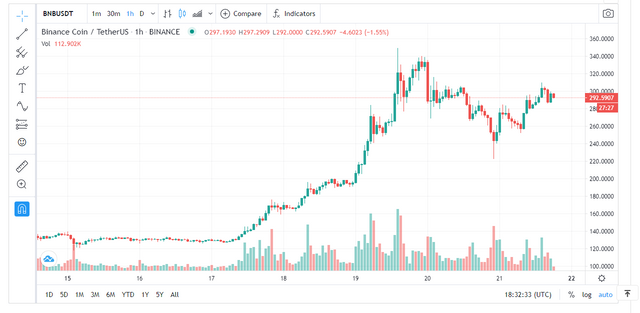
in this 1hr time frame, we can see it is first in bullish then it became slightly bearish, and then trying to become bullish. SO this is how we can find the two different trends in the same asset in different time frames.
4. Type of Traders
we can categories the traders in different-different ways. like the time frame of the asset holding, behavior of the trade.
To my knowledge, there are only two types of traders according to t their trade behavior one is bulls and another is born. Bull are those who make the market in an upward direction and bears are those who move the market in a downward direction.
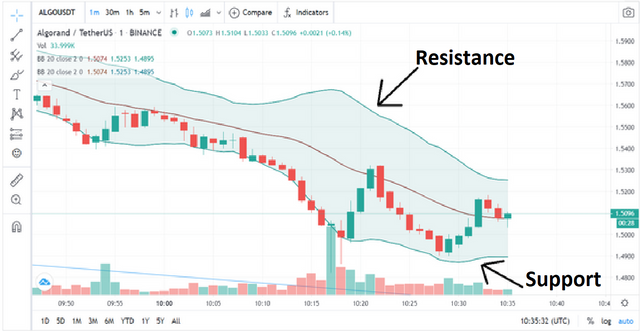
5. Support and Resistance
Support is something from where asset get support and bounce back and resistance is from where asset falls down.
so from here, we can assume the importance of support and resistance. if you know from where the price can go down so you will sell the asset that position and if you know from where the asset will bounce back so you can buy from that position. This is the definition & importance of support and resistance according to me.
6. How to find the Support in the candle chart.
I mentioned my last post itself. I did not know the many indicators. knows very few and they work most of the time and one of them is the Bollinger Band indicator. I personally use Bollinger Bands in my trades. This is one of the easiest ways to find the support and resistance of an asset.
There are more popular and effective indicators and techniques also but I'm comfortable with this one. you guys also can choose wisely.
7. After finding Support, when and where we need to place a buy order?
As I do not do much trading. So don't have an exact answer to this question but I can share my personal thought. As I mentioned above that I use Bollinger Bands. So I follow the bad and take a look at the trend of the particular asset. if the price touches the support but it's still in the downtrend then I prefer to wait for some more days and observe the movement of the asset.
So this is all from my end. Hope I cover all the questions and answered them correctly.
Note: All the images are taken from somewhere from the internet and the Screenshots of charts are taken from Coingeckowebsite.
Thank You For Showing Your Intrest in Steemit Crypto Academy
You have completed the homework task and made a good post, explained very nicely about How To Read Candlestick Charts In Different Time Frame & Information about Buy-Sell(Support &
Resistance).
Remark: Homework Task Completed.
Thank You.
@stream4u
Crypto Professors : Steemit Crypto Academy
#india #affable
Downvoting a post can decrease pending rewards and make it less visible. Common reasons:
Submit