source

1. Explain Rectangle Pattern in your own word.
The rectangle pattern in cryptocurrency trading refers to a pattern which is a classical tool for technical analysis made up of horizontal lines which mark out important areas of resistance and support in the price action of a cryptocurrency asset. Normally, the most basic idea and concept on trading with this technical system is to simply buy at support and sell at resistance or patiently wait and anticipate the price breakout from this channel - that is, the formation of the rectangle pattern - and use a certain measuring principle to determine how to trade the breakout. Often, it is understood through this pattern that there is no particular observable trend in the market; the price simply oscillates or moves up and down in between noticeable areas of resistance and support.
The rectangle pattern simply comes to an end if a breakout which is usually anticipated eventually occurs. In this case the price moves outside the defined rectangle pattern to create a trend in a particular observable direction. Many traders would prefer to simply wait for the breakout to occur to make an entry while a lot of others buy near the bottom or short the market near the top. In the full sense of it, the formation of the rectangle in any asset represents a technical price pattern. So, the rectangle formation is considered one of the standard price patterns that came from the works of Richard Schabaker who is often referred to as the father of technical analysis in trading, as well as Edwards and Magee who eventually came out with a sort of social Bible of price patterns for trading.
With the formation of the rectangle pattern, both demand and supply are considered to be in an approximate balance position for the period of time it occurs. The price of the underlying asset simply oscillates within a narrow range and regularly gets to resistance which is formed at the top of the rectangle and equally finds some support at the bottom of it. Understandably, this pattern could remain in the market even for a long period of time or could be short-lived in a period of low-volatility. Equally, it could tend towards the appearance of a square when its proportions are considered based on findings by Schabaker. Whatever the case may be, the rectangle pattern simply amplifies the indecision of traders in the market. It can be defined as a market where neither the bulls nor the bears are in control or significantly more powerful than the other.
2. How to identify Rectangles. Explain with Screenshots.
In order to identify a rectangle pattern it is necessary to first identify a trending market that seems to have gone into a period of consolidation. Then, you would have to identify at least two bottoms and two tops that respectively constitute the support and resistance areas and these must be in a horizontal alignment with one another.
Ordinarily the trend could become over extended and momentarily flatten out to create the channel that becomes the trading range of the rectangle pattern. When the trend pauses it creates either the first bottom or the first top. Subsequent price swings create other bottoms or tops that represent the support and resistance. It gives the impression that the price action is at that moment imprisoned within a rectangular box.
source
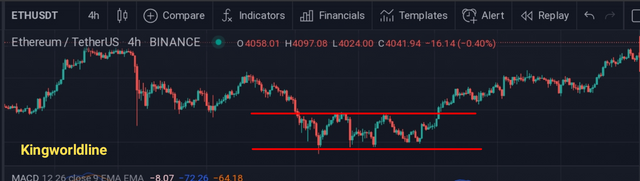
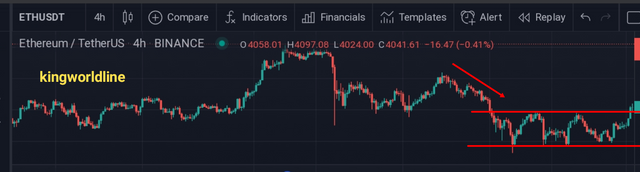
From the image above you can see that the price had been in a downtrend. This downtrend suddenly pauses and creates the first bottom. It meanders upwards creating a top above which it failed to go. It begins to oscillate within the price range delineated by the two parallel lines. Overall, the entire channel which eventually breaks out to the upside appears like a rectangle. This constitutes the rectangle trading pattern. It can occur for both bullish and bearish markets.
3. Can we use indicators with this pattern to get accurate results? Explain with Screenshots.
It is possible to use other indicators with the rectangle pattern and look out for areas of confluence in order to obtain more accurate trading results. One of the indicators that can be used with the formation of the rectangle pattern is the moving average convergence-divergence (MACD). The MACD is very popular for its use as a tool for determining the changes in price, which could occur very quickly, to help determine the momentum which accompanies a breakout of the price action.
There is a histogram through which it is possible for a trader to understand the velocity of price action as it moves closer to a line of support or resistance in confluence with the bottom or top of the rectangle pattern formation. Actually, the MACD can make it easier to spot a breakout that is likely to occur when used together with the formation of a rectangle pattern in the sense that the rate of acceleration of the price movement before it even reaches the line of either support or resistance can be studied from the rising or falling volume of the histogram of the MACD.
Equally, when the MACD is used together with the formation of a rectangle pattern, it is possible for a trader to determine when to close his position. This would be based on the ability of the MACD to indicate rising or slowing momentum in the market. When the MACD shows that the market is slowing down in momentum as it approaches the rectangle top or bottom, a potential reversal of the price can be anticipated. This can be seen from the point where the histogram either begins to flatten or even switch positions from either red to green or vice versa. This would have to inform timely stop-loss or position-closing orders to either minimise loss or maximize gain for a trader.
source
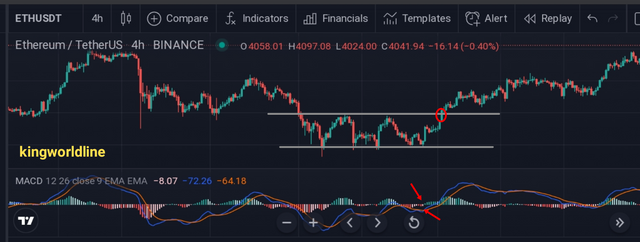
In the bearish rectangle pattern formed above the histogram of the MACD switches from bearish to bullish sentiments. This is equally marked by the signal line of the MACD crossing above as the rectangle pattern breaks above the prior resistance level to continue in a bullish direction. The confluence of this rectangle pattern breakout with the crossover of the MACD provides a very profitable buy signal.
4. Explain Rectangle Tops and Rectangle Bottoms in your own words with Screenshots of both patterns.
Rectangle Tops
Rectangle tops develop as a continuation pattern in a situation whereby a strong uptrend is observed in the market. Usually, once a rectangle top is formed a break would be witnessed in an uptrending market. Normally, traders of the rectangle top in this case would expect the bullish trend to resume or continue after the consolidation. However, this may not always be the case.
source
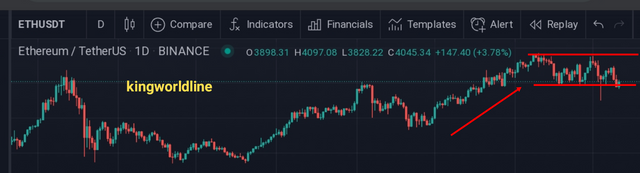
In the image above it can be observed that a strong uptrend is in place. This strong uptrend flows into a price channel where the price action begins to oscillate between support and resistance lines. It seems like a pattern has been created between bears and bulls and the bulls are no longer able to push prices further upwards.
Rectangle Bottoms
The rectangle bottom is usually formed in a strong downtrend. The rectangle bottom would develop as a continuation pattern in a situation whereby a strong downtrend is observed in the market. Usually, once a rectangle bottom is formed a break would be witnessed in a downtrending market. Normally, traders of the rectangle bottom in this case would expect the bearish trend to resume or continue after the consolidation. However, this may not always be the case.
source
In the image above it can be observed that a strong downtrend is in place. This strong downtrend flows into a price channel where the price action begins to oscillate between resistance and support lines. It seems like a pattern has been created between bulls and bears and the bears are no longer able to push prices further downwards.
5. Show full trade setup using this pattern for both trends. ( Entry Point, Take Profit, Stop Loss, Breakout)
Uptrend
source
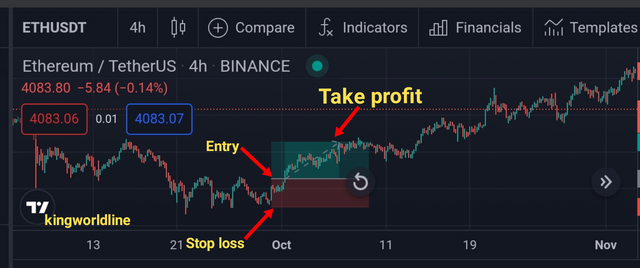
For an upwards break out of price action in a rectangle top, I:-
- Made an entry at the confirmation candle which breaks out above the predefined resistance level
- I set my stop loss and take profit in a 1:1.31 risk reward ratio
- The take profit was up 15.88% in the anticipated direction while the stop-loss was at 12.08% below my point of entry immediately below the preceding support line
CONCLUSION
The rectangle pattern is very classical when applied in the trading of cryptocurrencies. It is made up of important areas of support and resistance between which price action oscillates and fails to break above or below within a period of time. The most basic concept when it comes to the trading of this type of pattern is to anticipate a breakout of the price action in the direction of the prayer trend. However, this may not always be the case as a reversal could eventually occur.
Once a breakout occurs, the rectangle pattern has come to an end and has been invalidated. Traders would hope to profit from this breakout especially when confirmed in confluence with other technical indicators. Nevertheless, profits can still be made by shorting the resistance and buying the support levels which occur between the rectangle pattern especially if it lasts for a longer period of time.
Hello @kingworldline. I am glad you participated in 4th week of Season 5.
You have edited your posts and edited the question 5 after the deadline.
Remark - Homework Task Disqualified
Downvoting a post can decrease pending rewards and make it less visible. Common reasons:
Submit
Am sorry for that, i forgot to add up question 5, after writing on my note pad, when i discovered it, it was late. thanks for your understanding
Downvoting a post can decrease pending rewards and make it less visible. Common reasons:
Submit
Hi @sachin08, Professor-Beginner[Dynamic]
The user has submitted within the deadline.
The task may please be curated.
Thanks.
Cc: @kingworldline
Downvoting a post can decrease pending rewards and make it less visible. Common reasons:
Submit
Actually, this user has edited the task and added question 5 after the deadline.
Downvoting a post can decrease pending rewards and make it less visible. Common reasons:
Submit
Okay, in that case, either you can reduce the marks or disqualify if there are major edits/changes.
Thank you.
Downvoting a post can decrease pending rewards and make it less visible. Common reasons:
Submit
Thanks for your concern sir..
Downvoting a post can decrease pending rewards and make it less visible. Common reasons:
Submit